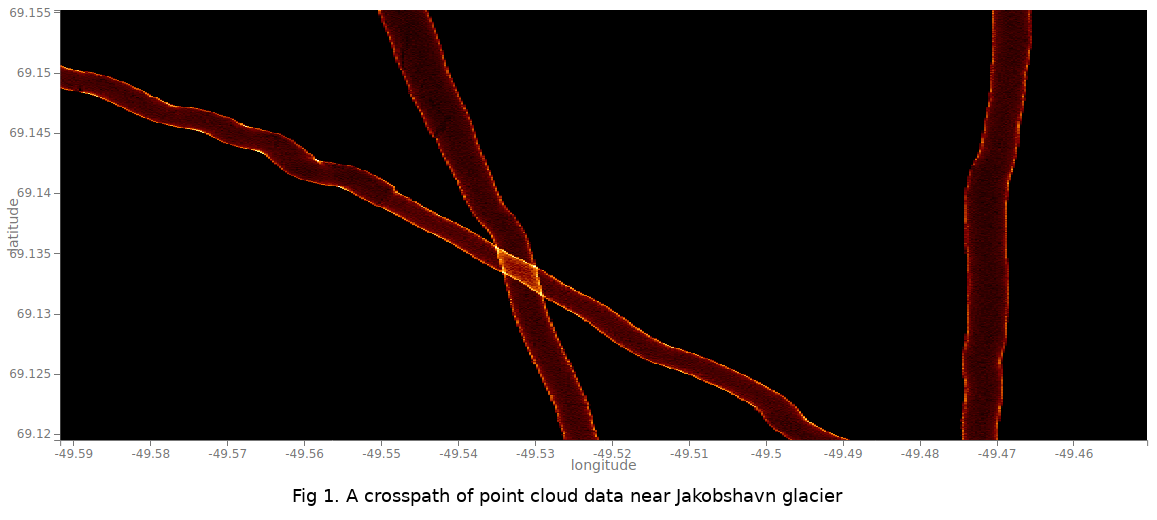
Altimetry Data at the NSIDC DAAC: Point Cloud Data Overview
Altimetry Data Introduction
This page aims to teach students and researchers interested in cryospheric sciences about airborne altimetry and related data sets from NASA’s IceBridge mission, and satellite altimetry data from ICESat/GLAS and ICESat-2. Accessing and combining data from these different missions can be difficult as file formats and coordinate reference systems changed over time.
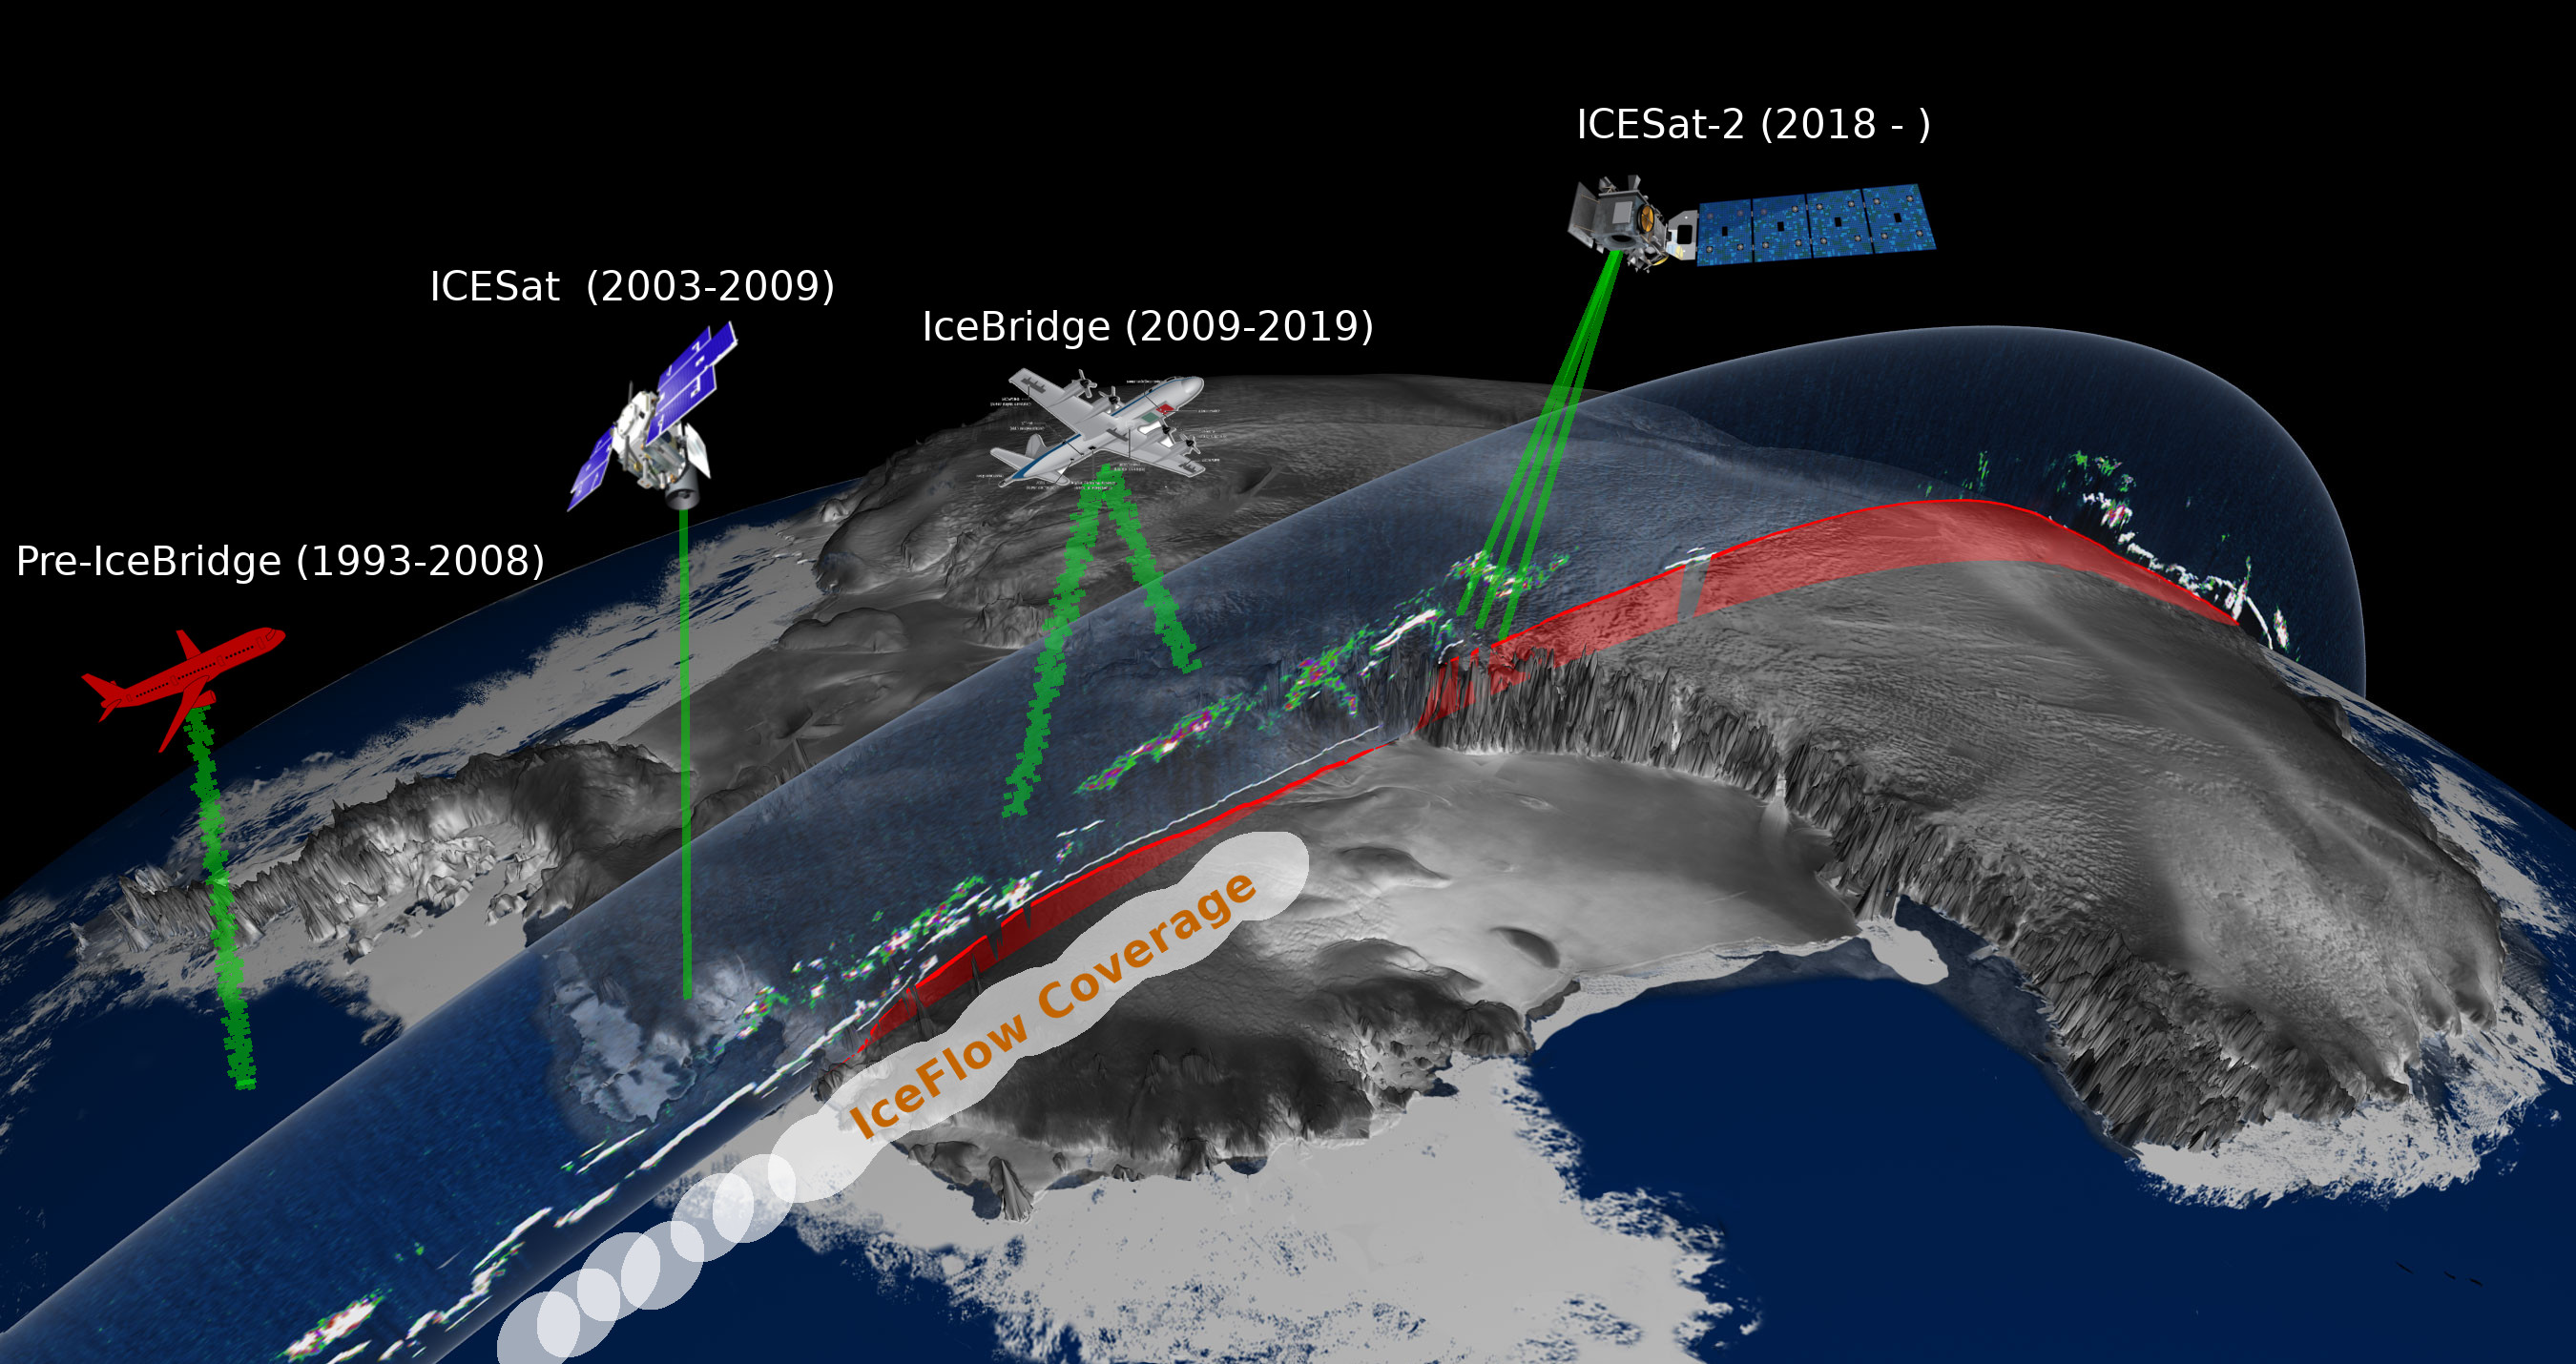
Mission Overview
In 2003, NASA launched the Ice, Cloud and Land Elevation Satellite mission with the Geoscience Laser Altimeter System (ICESat/GLAS) instrument onboard. Over the following six years, ICESat/GLAS collected valuable ice thickness data in the Polar Regions. Unfortunately, the ICESat/GLAS mission ended in 2009 before a follow-up mission could be launched. An airborne campaign called Operation IceBridge was funded to fill the gap and continue ice thickness measurements. Between 2009 and 2019, Operation IceBridge flew numerous campaigns over Greenland, the Antarctic ice sheets, and sea ice in the Arctic and Southern Ocean. In September 2018, ICESat-2 was launched to continue NASA’s collection of ice, cloud and land elevation data.
Pre-IceBridge
The Airborne Topographic Mapper (ATM) is a conically-scanning laser altimeter that measures the surface topography of a swath of terrain directly beneath the path of an aircraft. ATM surveys can be used to detect surface changes. Differences of laser swaths surveyed over the same area but a few years apart can be used to estimate elevation changes between the first and second survey. Comparing the surveys conducted 1993-4 and 1998-9 resulted in the first comprehensive assessment of the mass balance change of the Greenland ice sheet (Krabill et al., 1999, 2000). ATM surveys can also be used to calibrate/validate satellite altimeter measurements (e.g. Martin et al., 2005). The ATM was deployed on a wide variety of platforms, including the NASA P3, a Chilean Navy P3, a US Navy P3, the NASA DC8, the NCAR C-130, and a half-dozen Twin Otters to collected high quality topographic data. For a complete list of the ATM deployments visit https://atm.wff.nasa.gov/deployments/
ICESat/GLAS
ICESat/GLAS was the benchmark Earth Observing System mission for measuring ice sheet mass balance, cloud and aerosol heights, as well as land topography and vegetation characteristics. From 2003 to 2009, the ICESat/GLAS mission provided multi-year elevation data for ice sheet mass balance as well as stratospheric cloud property information over polar areas. This mission also provided topographic and vegetation data from around the globe beyond the polar-specific ice height information over the Greenland and Antarctic ice sheets. Launched on 12 January 2003, after seven years in orbit and 18 laser-operation campaigns, the ICESat/GLAS science mission ended due to the failure of its primary instrument in 2009.
IceBridge
The operation IceBridge was with its surveying flights from 2009 to 2019 the largest airborne survey of the Earth’s polar ice. It has yielded an unprecedented three-dimensional view of the Arctic and Antarctic ice sheets, ice shelves and sea ice. The flights provide a yearly, multi-instrument look at the behavior of the rapidly changing features of the polar ice. Data collected during Operation IceBridge helps scientists bridge the gap in polar satellite observations between ICESat/GLAS (2003-2009) and ICESat-2 (2018-present). Although the IceBridge data are not continuous its mission became critical for extending the ice altimetry time series in the Arctic and Antarctic, after ICESat/GLAS stopped collecting data in 2009.
IceBridge flights were generally conducted in March-May over Greenland and in October-November over Antarctica.
ICESat-2
The ICESat-2 mission was designed to provide elevation data needed to determine ice sheet mass balance as well as vegetation canopy information. It provides topographic measurements of cities, lakes and reservoirs, oceans and land surfaces around the globe. The sole instrument on ICESat-2 is the Advanced Topographic Laser Altimeter System (ATLAS), a space-based Lidar. It was designed and built at Goddard Space Flight Center, with the laser generation and detection systems provided by Fibertek. ATLAS measures the travel time of laser photons from the satellite to Earth and back; travel times from multiple laser pulses are used to determine elevation data.
Note
We recommend using the icepyx
library to access and interact with ICESat-2 data. Learn more about using icepyx with nsidc-iceflow in the Using nsidc-iceflow with icepyx to Generate an Elevation Timeseries Jupyter notebook.
Data Sets and their Spatial and Temporal Coverage
NSIDC provides a list of all available data sets within each mission including further mission information and documentation for each data set:
Data Set |
Spatial Coverage |
Temporal Coverage |
Mission |
Sensors |
|---|---|---|---|---|
South: N:-53, S: -90, E:180, W:-180 |
23 Jun. 1993 - 30 Oct. 2008 |
Pre-IceBridge |
ATM |
|
South: N:-53, S: -90, E:180, W:-180 |
31 Mar. 2009 - 8 Nov. 2012 |
IceBridge |
ATM |
|
South: N:-53, S: -90, E:180, W:-180 |
20 Mar. 2013 - 16 May 2019 |
IceBridge |
ATM |
|
South: N:-53, S: -90, E:180, W:-180 |
14 Apr. 2009 - 31 Oct. 2015 |
IceBridge |
ALTIMETERS, LASERS, LVIS |
|
North: N:90, S: 60, E:180, W:-180 |
25 Aug. 2017 - 20 Sept. 2017 |
IceBridge |
ALTIMETERS, LASERS, LVIS |
|
Global: N:86, S: -86, E:180, W:-180 |
20 Feb. 2003 - 11 Oct. 2009 |
ICESat/GLAS |
ALTIMETERS, CD, GLAS, GPS, |
Note
If you have questions about the data sets please refer to the user guides or contact NSIDC user services at nsidc@nsidc.org
ILVIS2 data
ILVIS2 contain multiple sets of latitude/longitude/elevation values.
GLAT/GLON/GZrepresent the center of the lowest mode in the waveform.HLAT/HLON/HZrepresent the center of the highest detected mode within the waveform. Both of these sets of lat/lon/elev are available across v1 and v2 ILIVS data.
ILVIS V1 data:
CLAT/CLON/ZCrepresent the centroid of the corresponding LVIS Level-1B waveform.
ILVIS V2 data:
TLAT/TLON/ZT, which represent the highest detected signal.
By default, nsidc-iceflow will use GLAT/GLON/GZ as the primary
latitude/longitude/elevation fields in IceflowDataFrames. Use the
ilvis2_coordinate_set kwarg on read_iceflow_datafile(s) or
make_iceflow_parquet to select an different primary set of
latitude/longitude/elevation fields. Alternatively, manually set the fields:
# TLAT/TLON/TZ are only available in ILVIS2v2 data:
sel_ilvis2v2 = data.dataset == "ILVIS2v2"
data.loc[sel_ilvis2v2, ["latitude", "longitude", "elevation"]] = data.loc[sel_ilvis2v2, ["TLAT", "TLON", "ZT"]]
Challenges
The wealth of data from these missions presents an opportunity to study the evolution of ice thickness over several decades. However, combining data from these missions presents several challenges:
Data from the Airborne Topographic Mapper (ATM) flown during the IceBridge campaigns is stored in four different file formats. ICESat/GLAS and ICESat-2 data are also in different file formats. Therefore, the data needs to be harmonized, that means placed into similar formats before comparisons can be made.
The coordinate reference systems used to locate measurements have changed over the years, as the Earth’s surface is not static and changes shape. To account for these changes, terrestrial reference frames that relate latitude and longitude to points on the Earth are updated on a regular basis. Since the launch of ICESat/GLAS, the International Terrestrial Reference Frame (ITRF) has been updated three times. The geolocation of a point measured at the beginning of the record and the end of the record is not the same even though the latitude and longitude is the same. These changes in geolocation need to be reconciled to allow meaningful comparisons within the long-term data record.
The nsidc-iceflow Python library addresses these concerns by providing the
ability to search, download, and access laser altimetry data from
(pre-)Operation IceBridge and ICESat/GLAS datasets. The library also supports
International Terrestrial Reference Frame (ITRF) transformations to facilitate
comparisons across datasets.
Companion Jupyter notebooks give additional information and contain example code
about nsidc-iceflow.
NSIDC Iceflow example provides an example of how
to search for, download, and interact with ILATM1B v1 data for a small area of
interest. This notebook also illustrates how to perform
ITRF transformations to facilitate comparisons across
datasets. To learn more about ITRF transformations, see the
Applying Coordinate Transformations to Facilitate Data Comparison
notebook.
Using nsidc-iceflow with icepyx to Generate an Elevation Timeseries
shows how to search for, download, and interact with a large amount of data
across many datasets supported by nsidc-iceflow. It also illustrates how to
utilize icepyx to find and access
ICESat-2 data. Finally, the notebook provides a simple time-series analysis for
elevation change over an area of interest across nsidc-iceflow supported
datasets and ICESat-2.
References
Next steps
With the knowledge gained from reading this page, users should be prepared for
the NSIDC Iceflow example notebook, which
provides an example of how to search for, download, and interact with
ILATM1B v1 data for a small area of interest with the nsidc-iceflow library.